1、记住一点,那就是随机性,每次运行结果都可能不同。
加载numpy里面的模块和作图模块matplotlib:
from numpy import random
import matplotlib
import matplotlib.pyplot as plt

2、给出一个随机的36*2的实数矩阵:
x = random.rand(36,2)
print(x)

3、绘制散点图:
plt.scatter(x[:,1],x[:,0],color = "red")
plt.show()
以x的第二列为各点的横坐标,第一列为纵坐标。

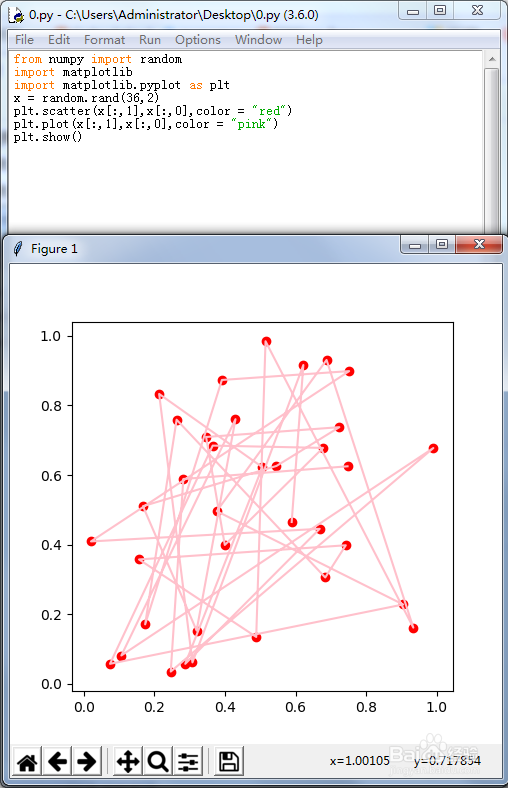
4、把折线图也画出来:
plt.scatter(x[:,1],x[:,0],color = "red")
plt.plot(x[:,1],x[:,0],color = "pink")
plt.show()
5、如果希望随机点的横坐标依次是0到35,可以这样:
x = random.rand(36,2)
a = range(36)
plt.scatter(a,x[:,0],color = "red")
plt.plot(a,x[:,0],color = "blue")
plt.show()

6、当然,也可以让纵坐标整齐化:
x = random.rand(36,2)
a = range(36)
plt.scatter(x[:,1],a,color = "red")
plt.plot(x[:,1],a,color = "green")
plt.show()

7、下面是一个正弦曲线上的随机扰动:
x = random.rand(100,2)
a = range(0,100,1)
b = []
for i in a:
b.append(math.sin(i/10)*2+x[:,1][i])
plt.scatter(a,b,color = "red")
plt.plot(a,b,color = "green")
plt.show()
